
File:Interferenz.jpg
本预览的尺寸:600 × 600像素。 其他分辨率:240 × 240像素 | 480 × 480像素 | 768 × 768像素 | 1,024 × 1,024像素 | 2,000 × 2,000像素。
原始文件 (2,000 × 2,000像素,文件大小:634 KB,MIME类型:image/jpeg)
摘要
| 描述 |
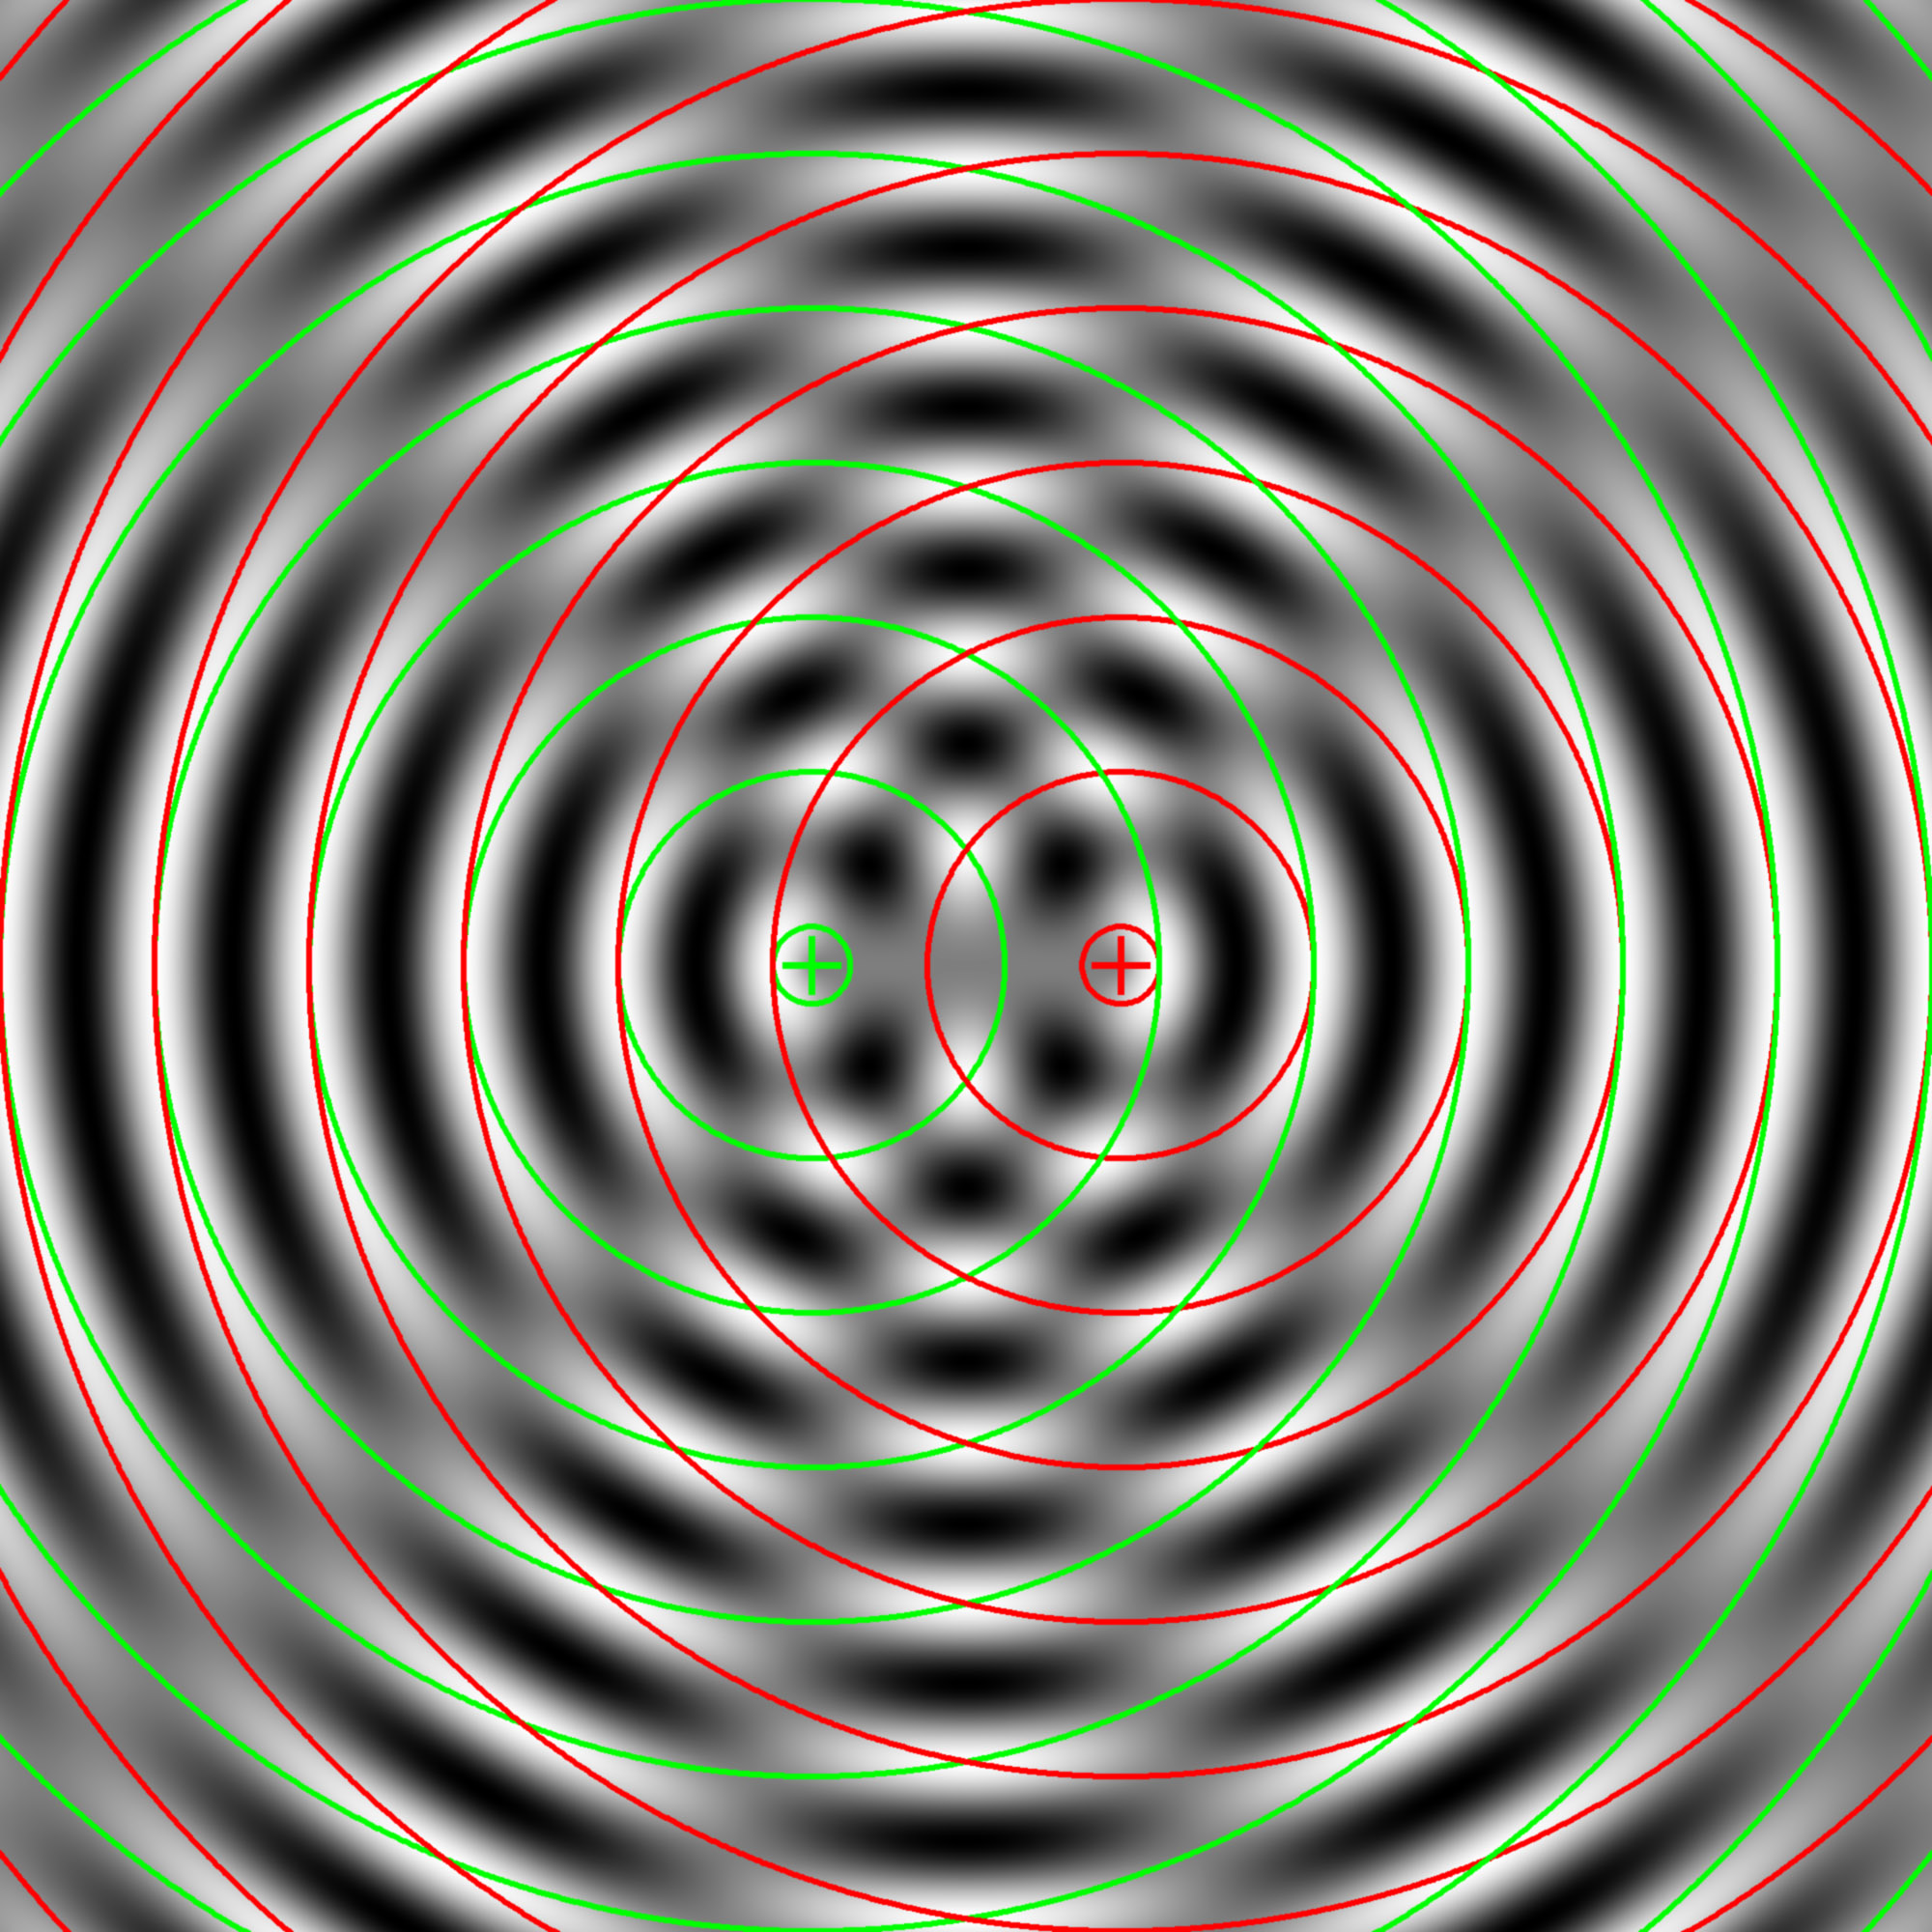
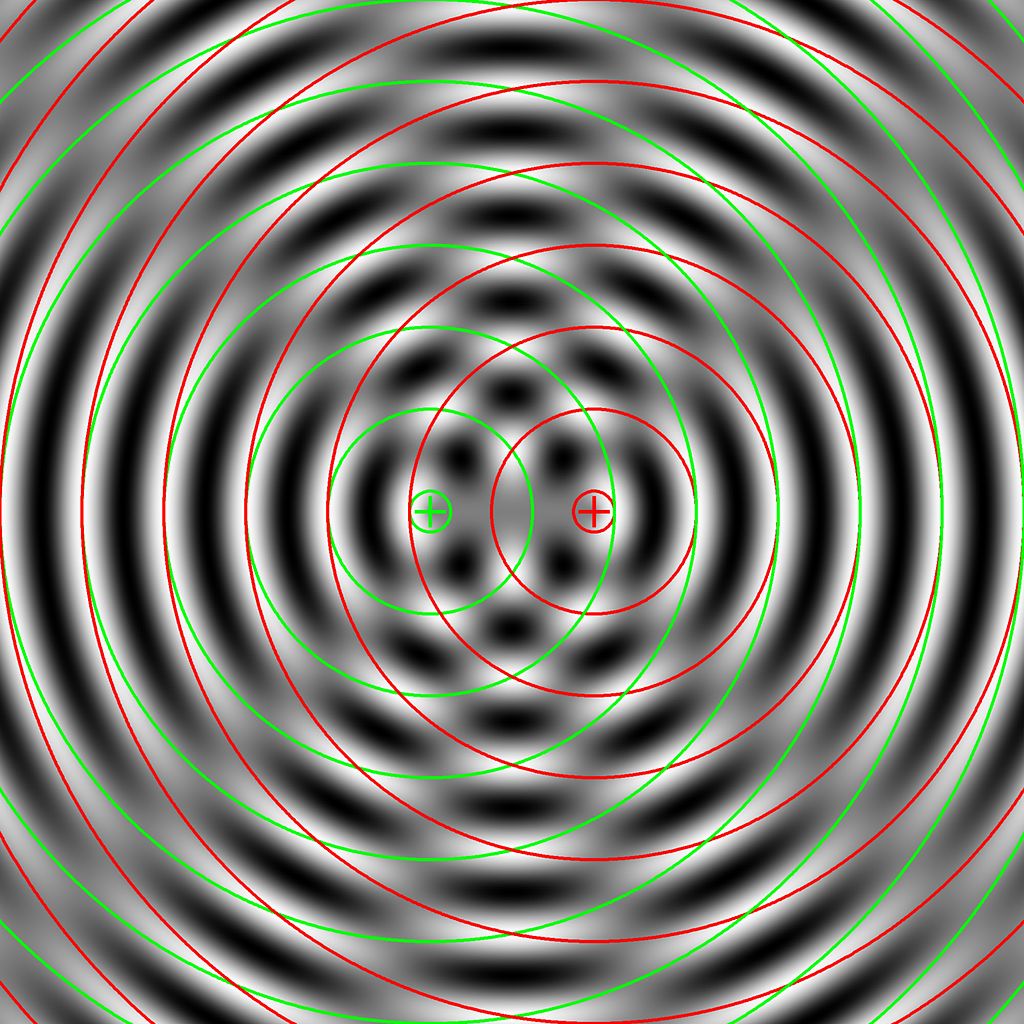
Deutsch: Simuliertes Interferenzbild zweier punktförmiger Quellen mit gleicher Wellenlänge. Die Lagen der Quellen sind durch Kreuze gekennzeichnet, die Maxima beider Wellen durch farbige Kreise. |
| 日期 | |
| 来源 | 自己的作品 |
| 作者 | Dr. Schorsch 12:32, 19 Apr 2005 (UTC) (Dr. Schorsch (talk)) |
许可协议
我,本作品著作权人,特此采用以下许可协议发表本作品:

|
已授权您依据自由软件基金会发行的无固定段落及封面封底文字(Invariant Sections, Front-Cover Texts, and Back-Cover Texts)的GNU自由文件许可协议1.2版或任意后续版本的条款,复制、传播和/或修改本文件。该协议的副本请见“GNU Free Documentation License”。 |
- 您可以自由地:
- 共享 – 复制、发行并传播本作品
- 修改 – 改编作品
- 惟须遵守下列条件:
- 署名 – 您必须对作品进行署名,提供授权条款的链接,并说明是否对原始内容进行了更改。您可以用任何合理的方式来署名,但不得以任何方式表明许可人认可您或您的使用。
- 相同方式共享 – 如果您再混合、转换或者基于本作品进行创作,您必须以与原先许可协议相同或相兼容的许可协议分发您贡献的作品。
您可以选择您需要的许可协议。
Source Code
This is the source code of the program I used to create this image. Click on “Show source code” to display it.
The following program is under the GNU General Public License (GPL).
|
|
本作品为自由软件,您可以依据自由软件基金会发行的GNU通用公共许可证第2版或任意后续版本的条款,传播和/或修改本作品。本作品发表时预期有用,但对此无任何保证,亦无隐含的可以销售或适合特定目的的保证。详情请见GNU通用公共许可证第2版和第3版。 |
; Program Written in IDL (Interactive Data Language)
; Free Interpreter availible at www.rsinc.com
; Written by Georg Wiora
; This Program is under the  GNU General Public License (GPL)
;
; Create a display of interference patterns
; Save this text as file "Interference2.pro" to run it.

; Draw a circle
PRO circle,x,y,r,_REF_EXTRA=ex
  n=ULONG(!DPI*r) > 1
  phi = FINDGEN(n)/FLOAT(n)*2*!DPI
  x1 = r*COS(phi)+x
  y1 = r*SIN(phi)+y
  PLOTS,[x1,x1[0]],[y1,y1[0]],_STRICT_EXTRA=ex
END

; Compute the interference
PRO Interference2
   ; Final Image Size
  siz=2000
  ; No display if larger than 800x1600 pixel
  pixmap=SIZ GT 800
  ; Wavelength in Pixel
  lambda=160
  ; Half distance of the sources
  dhalb = lambda

  ; Compute the distance of each point in an array from the
  ; center point: This is the phase of the signal
  d1 = SHIFT(DIST(siz*2,siz),siz,siz/2)
  ; Sinus of distace with 0 LE amplitude LE 2
  f = SIN(d1/lambda*2*!DPI)+1
  ; Compute Interference
  inter = SHIFT(f,-dhalb,0)+SHIFT(f,dhalb,0)
  ; Get maximum and minimum
  ma = MAX(inter,MIN=mi)
  ; Two colors are reserved for marking, the rest is gray scale
  ; Scale interference to byte range [0..253]
  inter = BYTE((TEMPORARY(inter)-mi)/(ma-mi)*253)

  ; Use lookup table to display
  DEVICE,DECOMPOSED=0
  ; Gray scale
  LOADCT,0
  ; Half length of center cross bars in pixel
  cs=30
  ; Half width of center cross bars in pixel
  cb=3

  ; Set mark for center
  ; Horizontal left
  inter[siz-dhalb-cs:siz-dhalb+cs, siz/2-cb:siz/2+cb] = 254
  ; Vertical left
  inter[siz-dhalb-cb:siz-dhalb+cb, siz/2-cs:siz/2+cs] = 254
  ; Horizontal right
  inter[siz+dhalb-cs:siz+dhalb+cs, siz/2-cb:siz/2+cb] = 255
  ; Vertical right
  inter[siz+dhalb-cb:siz+dhalb+cb, siz/2-cs:siz/2+cs] = 255

  ; Open a visible or invisible window (depends on pixmap flag)
  WINDOW,XSIZE=2*siz,YSIZE=siz,PIXMAP=pixmap
  ; Display the interference (only gray scale!)
  TV,inter
  ; Draw circles on maximum locations
  FOR i=0,2.5*siz/lambda DO $
  BEGIN
    ; Maximum location left
    circle,siz-dhalb,siz/2,(i+0.25)*lambda,THICK=6,/DEVICE,COLOR=254
    ; Maximum location right
    circle,siz+dhalb,siz/2,(i+0.25)*lambda,THICK=6,/DEVICE,COLOR=255
  ENDFOR

  ; Colortable 0-253 as gray scake
  r = FINDGEN(256)/253*255
  g=r
  b=r
  ; 254 is green
  r[254]=0
  b[254]=0
  g[254]=255
  ; 255 is red
  r[255]=255
  b[255]=0
  g[255]=0

  ; Read image from display
  im=TVRD()
  ; Crop invalid borders
  im = im[siz/2:3*siz/2-1,*]

  ; Save as PNG with colortable
  WRITE_PNG,'Interference2.png',im,r,g,b
  ; Convert to truecolor and write JPEG
  imt = [[[r[im]]],[[g[im]]],[[b[im]]]]
  ; smooth image a little bit (saves bandwith in jpeg and is OK
  ; with high resolution)
  imt[*,*,0] = SMOOTH(imt[*,*,0],3,/EDGE_TRUNCATE)
  imt[*,*,1] = SMOOTH(imt[*,*,1],3,/EDGE_TRUNCATE)
  imt[*,*,2] = SMOOTH(imt[*,*,2],3,/EDGE_TRUNCATE)
  ; Write as jpeg
  WRITE_JPEG,'Interference2.jpg',TEMPORARY(imt),/PROGRESSIVE,$
             QUALITY=90, TRUE=3
END
文件历史
点击某个日期/时间查看对应时刻的文件。
| 日期/时间 | 缩略图 | 大小 | 用户 | 备注 | |
|---|---|---|---|---|---|
| 当前 | 2005年4月19日 (二) 14:26 | | 2,000 × 2,000(634 KB) | Xorx | |
| 2005年4月19日 (二) 12:28 |  | 2,000 × 2,000(310 KB) | Xorx | Simuliertes Interferenzbild zweier punktförmiger Quellen mit gleicher Wellenlänge. {{GFDL}} |
文件用途
以下3个页面使用本文件:
全域文件用途
以下其他wiki使用此文件:
- bs.wikipedia.org上的用途
- ca.wikipedia.org上的用途
- da.wikipedia.org上的用途
- de.wikipedia.org上的用途
- fr.wikipedia.org上的用途
- fr.wikibooks.org上的用途
- fr.wikiversity.org上的用途
- hr.wikipedia.org上的用途
- it.wikipedia.org上的用途
- it.wikiversity.org上的用途
- ja.wikipedia.org上的用途
- ja.wikibooks.org上的用途
- lb.wikipedia.org上的用途
- no.wikibooks.org上的用途
- pl.wiktionary.org上的用途
- sh.wikipedia.org上的用途
- simple.wikipedia.org上的用途
- sk.wikipedia.org上的用途
- sr.wikipedia.org上的用途
- te.wikipedia.org上的用途
- th.wikipedia.org上的用途